| Oracle® Database Administrator's Guide 11g Release 1 (11.1) Part Number B28310-01 |
|
|
View PDF |
| Oracle® Database Administrator's Guide 11g Release 1 (11.1) Part Number B28310-01 |
|
|
View PDF |
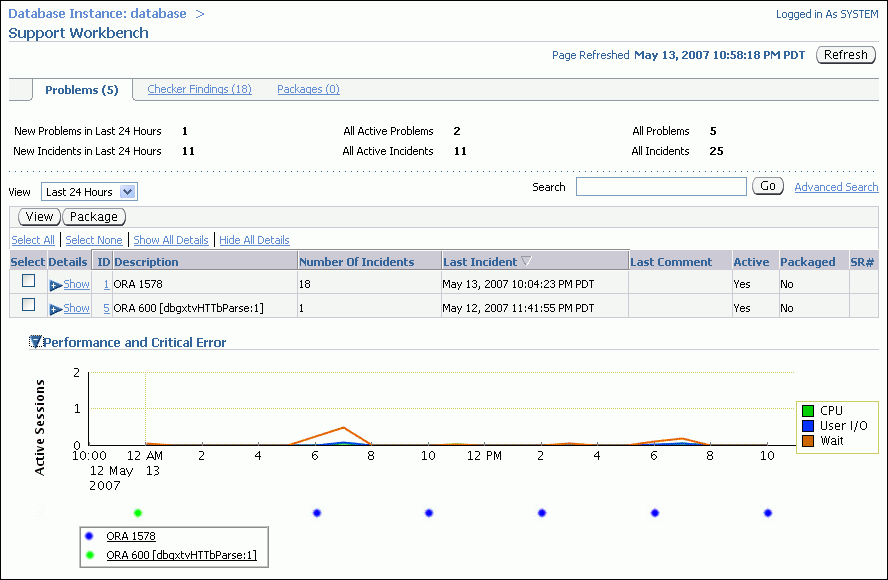
You use the Enterprise Manager Support Workbench home page (Figure 8-4) to view all problems or only those within a specified time period.
Figure 8-4 Enterprise Manager Support Workbench Home Page

To access the Support Workbench home page:
Access the Database Home page in Enterprise Manager.
See Oracle Database 2 Day DBA for the instructions for Oracle Enterprise Manager Database Control. For Oracle Enterprise Manager Grid Control, go to the desired database target.
Click Software and Support to view the Software and Support page.
In the Support section, click Support Workbench.
The Support Workbench home page appears, showing the Problems subpage. By default the problems from the last 24 hours are displayed.
To view all problems, select All from the View list.
(Optional) If the Performance and Critical Error section is hidden, click the Show/Hide icon adjacent to the section heading to show the section.
This section enables you to view any correlation between performance changes and incident occurrences.
(Optional) Under the Details column, click Show to display a list of all incidents for a problem, and then click an incident ID to display the Incident Details page.
To view details for a particular problem:
On the Support Workbench home page, select the problem, and then click View.
The Problem Details page appears, showing the Incidents subpage. The incidents subpage shows all incidents that are open and that generated dumps—that is, that were not flood-controlled.
(Optional) To view both open and closed incidents, select All Incidents in the Status list. To view both normal and flood-controlled incidents, select All Incidents in the Data Dumped list.
(Optional) To view details for an incident, select the incident, and then click View.
The Incident Details page appears.
(Optional) On the Incident Details page, to view checker findings for the incident, click Checker Findings.
(Optional) On the Incident Details page, to view the user actions that are available to you for the incident, click Additional Diagnostics. Each user action provides a way for you to gather additional diagnostics for the incident or its problem.
See Also:
"Incident Flood Control"